
Reading: Wooldridge Ch 4
1. Consider an equation to explain salaries of CEOs in terms of annual firm sales, return on equity (roe, in percentage form), and return on the firm’s stock (ros, in percentage form):
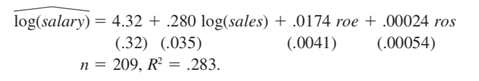
(i)
By what percentage is salary predicted to increase if ros increases by 50 points?
Does ros have a practically large effect on salary?
(ii) Test the null hypothesis that ros has no effect on salary against the alternative that
ros has a positive effect. Carry out the test at the 10% significance level.
(iii) Would you include ros in a final model explaining CEO compensation in terms of
firm performance? Explain.
2. Are rent rates influenced by the student population in a college town? Let rent be the aver- age monthly rent paid on rental units in a college town in the United States. Let pop denote the total city population, avginc the average city income, and pctstu the student population as a percentage of the total population. The equation is estimated for 64 college towns:
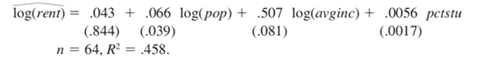
(i) If population increases by 10%, what is the expected increase in rent?
(ii) Test the following hypothesis at the 1% level: The size of the student body relative to the population has no ceteris paribus effect on monthly rents.
(iii) Using the standard normal approximation, find the 95% confidence interval for
the coefficient on average city income.
(iv) Can you reject the hypothesis H0: the coefficient on average city income equals 0.55, against the two-sided alternative at the
5% level?
3. Consider the estimated equation
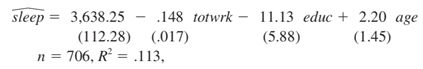
(i) Is either educ or age individually significant at the 5% level against a two-sided
alternative? Show your work.
(ii) Dropping educ and age from the equation gives
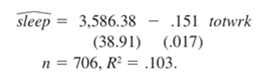
Are educ and age jointly significant in the original equation at the 5% level? Justify
your answer.
(iii) Does including educ and age in the model greatly affect the estimated tradeoff
between sleeping and working?
(iv) Suppose that the sleep equation contains heteroskedasticity. What does this mean
about the tests computed in parts (i) and (ii)?
Computer problem
4. Use the data in DISCRIM to answer this question. These are ZIP code–level data on prices for various items at fast-food restaurants, along with characteristics of the zip code population, in New Jersey and Pennsylvania. The idea is to see whether fast-food restaurants charge higher prices in areas with a larger concentration of blacks.
(i) Estimate this model by OLS. If the dataset contains observations with missing values on your X or Y variables, be sure to exclude those records.
psoda = β0 + β1 prpblck+ β2 income + u
Report the results in equation form, including the sample size and R-squared. Interpret the coefficient on prpblck. Do you think it is economically large?
(ii) Compare the estimate above with the simple regression estimate from psoda on prpblck. Is the discrimination effect larger or smaller when you control for income?
(iii) A model with a constant price elasticity with respect to income may be more appropriate. Report estimates of the model
log(psoda) = β0 + β1 prpblck+ β2 log(income) + u
If prpblck increases by .20 (20 percentage points), what is the estimated percentage
change in psoda? (Hint: The answer is 2.xx, where you fill in the “xx.”)
(iv) Use OLS to estimate the model
log(psoda) = β0 + β1 prpblck+ β2 log(income) + β3 prppov + u
Report the results in the usual form. Is β1 statistically different from zero at the
5% level against a two-sided alternative? What about at the 1% level?
(v) What is the correlation between log(income) and prppov? Is each variable statistically significant in any case? Report the two-sided p-values.
Evaluate the following statement: “Because log(income) and prppov are so highly correlated, they have no business being in the same regression.”
(vi) To the regression in part (iii), add the variable log(hseval). Interpret its coefficient
and report the two-sided p-value for H0: βlog(hseval) = 0.
(vii) In the regression above, what happens to the individual statistical significance
of log(income) and prppov? Are these variables jointly significant? (Compute a
p-value.) What do you make of your answers?
(viii) Given the results of all your regressions, which one would you report as most reliable in determining whether the racial makeup of a zip code influences local fast-food prices?

