
FEEDBACK: First calculate the multiplier. This is found by using the equation, ms = 1 ÷ (1 – MPC). With a marginal propensity to consume of 0.8, the multiplier is 5. An increase in government spending of $600 billion multiplied by the multiplier results in a $600 billion * 5 = $3,000 billion increase in real GDP.
FEEDBACK: Fiscal policy involves the use of spending or taxation by the federal government. During the Great Recession, the federal government provided tax refunds to all taxpayers and increased spending to build infrastructure. Both actions represent a form of fiscal policy.
(Use the Laffer curve, shown here, to support your answer.)

FEEDBACK: If the tax rate is in Region I of the Laffer curve, tax revenues would increase as the tax rate falls, and you wouldn’t be able to back up your promise to voters. But if the tax rate is in Region II of the Laffer curve, tax revenue would increase as the tax rate falls, and you’d keep your promise. This is because very high taxes are a disincentive for earning income. Lowering those taxes will lead people to work more, earning enough extra taxable income that the government takes in more revenue than they did with the higher tax rate.
Click to view larger image.
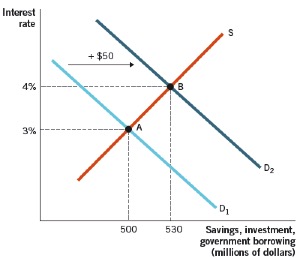
Suppose a small country is in recession and the government decides to increase spending to boost the economy, and decides to borrow $50 million to build statues of famous economists. Given this knowledge, and based on the graph above, which of the following statements is true?
(AD).
FEEDBACK: Originally, the market is in equilibrium at point A, with an interest rate of 3% and savings and investment being equal at $500 million. Then the demand for loans increases by $50 million at all points when the government borrows $50 million. This change moves the market to a new equilibrium at point B. Government spending (G) will increase by $50 million. Total savings will increase from $500 million to $530 million, which means that total savings will increase by $30 million and consumption (C) will fall by $30 million. But because the government is borrowing $50 million of the savings, private investment (I) will fall to $480 million, a decrease of $20 million. All of this means a net change of zero in aggregate demand
(AD).
Which of the following is true?
FEEDBACK: An impact lag would be present. An impact lag is the time it takes after a policy is enacted for its effects to be completely felt in the economy. In this case, the policy is all about government spending, but because it takes a long time to build the libraries, it’s a while before all the money is completely paid to the construction workers and others doing the work.
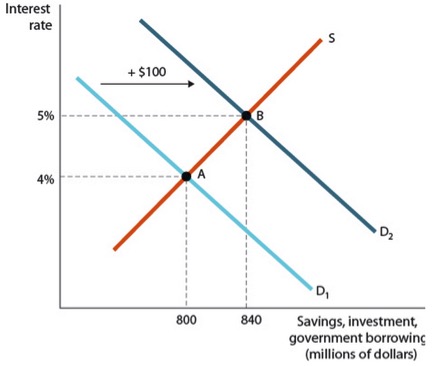
If we assume there was no government debt prior to the fiscal stimulus, determine the new quantities for the blanks below.
Savings: _______ million
Investment: _______ million
Private consumption decreases by: _______ million
FEEDBACK: When the demand for loanable funds shifts to the right, total savings increases by $40 million, for a new level of savings of $840 million. Government spending increases by $100 million as stated in the question. This means that private investment has $740 million of savings available ($840 million – $100 million). Finally, private consumption falls by $40 million as anything not consumed is considered savings. Recall that total savings increased by $40 million.
FEEDBACK: Crowding-out occurs when increased government spending causes a decrease in private spending. The new classical critique explains how saving shifting occurs. As government spending increases, people know they will have to pay higher taxes eventually, which increases current savings. An increase in savings results in the increase in the supply of loanable funds.
Which of the following is an example of a recognition lag?
FEEDBACK: A recognition lag occurs over the time period it takes to recognize and verify the existence of a situation that may require government action. A recognition lag occurs when economists take time to determine if conditions are bad enough.
FEEDBACK: From a supply-side perspective, the government can lower tax rates. This gives people the incentive to work harder and earn more income. In the process, more output is produced, thus shifting the short- and long-run aggregate supply curves. From a demand-side perspective, either partially refunding previously paid taxes or undertaking an infrastructure project (increasing government spending) should increase aggregate demand. Both represent an expansionary fiscal policy.
FEEDBACK: Pell grants are supply-side subsidies with the intent to increase human capital, which will increase future innovation and production. In general, demand-side fiscal policy focuses on incentives to increase spending, while supply-side fiscal policy focuses on incentives to increase production.
FEEDBACK: Contractionary fiscal policy would be implemented when the economy is in an expansion. The government will decrease government spending or increase taxes. If aggregate demand is too high, then the economy is operating past its natural equilibrium, with unemployment lower than the natural rate and output greater than the natural rate. This is unsustainable in the long run and causes pressures on prices to increase. Contractionary fiscal policy is used to keep prices under control.
FEEDBACK: The government enacted two significant fiscal policy initiatives. The first, signed in February 2008 by President George W. Bush, was the Economic Stimulus Act of 2008. The cornerstone of this act was a tax rebate for Americans. The overall cost of this action to government was $168 billion. In February 2009, less than one month after taking office, President Obama signed the American Recovery and Reinvestment Act (ARRA) of 2009. The focus of this second act shifted to government spending. Seventy percent of the ARRA cost was due to new government spending; the remaining 30% focused on tax credits. In addition, the size of this second fiscal stimulus— $787 billion—was more than four times larger than the first.

